
Read Part 1 : Help yourself in Debugging by using Call Stack and Immediate Window
In this post I am going to discuss about the “BreakPoint” which is one of the most used feature by developer to debugging application by breaking execution of program runtime at certain point. I am going to describe the feature provided in visual studio for breakpoint and how it’s useful for debugging code easily.
What is Breakpoint?
Breakpoint is feature provided in Microsoft Visual Studio which allows breaking execution of code at runtime when debugging application.
For Example:
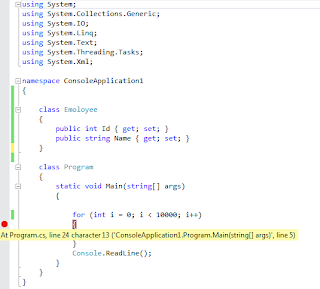
When you click on side of the code in visual studio it setup break point in you code as displayed in above image. So when you start execution code it will break execution at this point.
BreakPoint Menu (Option for the Break)
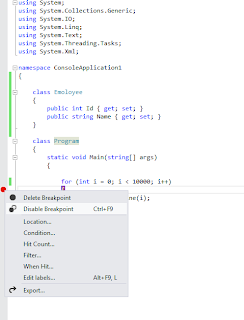
Above image display the context-menu for breakpoint i.e breakpoint menu. Following describe the all the option one by one.
Breakpoint/tracepoint set by developer in code is get displayed by this window. This window also displays breakpoint with other information.
Following is way which shows how one can start breakpoint window.
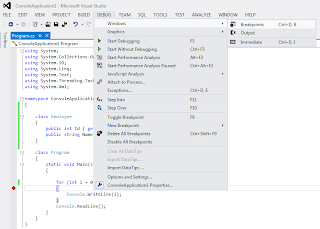
So one can either use debug menu and start breakpoint window or make use of short cut Ctrl+D,B.
Following is image of breakpoint window.
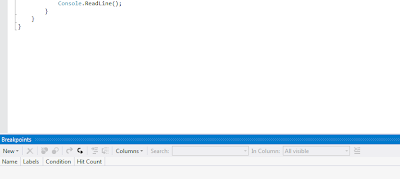
This window also has toolbar which allows following, which is also supported by breakpoint menu discussed above.
Breakpoint Grid
This grid window displays all the breakpoint set by developer in source code. This grid provides information about each breakpoint according to columns set by developer in grid.
Conclusion
Breakpoints/tracepoints are very useful feature provided in visual studio, which is very usefl when you are debugging large amount of code. Visual studio provides flexibility to break execution of the code during debugging at breakpoint which is very helpful to the developer.
In this post I am going to discuss about the “BreakPoint” which is one of the most used feature by developer to debugging application by breaking execution of program runtime at certain point. I am going to describe the feature provided in visual studio for breakpoint and how it’s useful for debugging code easily.
What is Breakpoint?
Breakpoint is feature provided in Microsoft Visual Studio which allows breaking execution of code at runtime when debugging application.
For Example:

When you click on side of the code in visual studio it setup break point in you code as displayed in above image. So when you start execution code it will break execution at this point.
BreakPoint Menu (Option for the Break)

Above image display the context-menu for breakpoint i.e breakpoint menu. Following describe the all the option one by one.
- Delete Breakpoint This option of the breakpoint menu allows removing breakpoint.
- Disable Breakpoint This option of the breakpoint menu allows disabling breakpoint, so the breakpoint just get disable and become gray. Useful when developer just want to execute code without stopping at breakpoint and later on enable when want to use it back.
- Location… This menu option allows setting break point at given location i.e. at given line in source code file.
- Condition… When this option clicked it below dialog get displayed which has two options.
- (A). IS true This option allows setting condition for breakpoint, so according to this execution during debugging get stopped at breakpoint i.e. breakpoint get hit when condition satisfied.
- (B). Has changed This option allows breaking execution of code at breakpoint when there is change in the variable or object.
- Hit Count… This option display count number of time breakpoint hit when executing program.
- Filter… This option allow to set condition related to “Machinename and Process” according to which breakpoint get hit. Following image explain more detail about it.
- When Hit… This option allows setting the message than get print to output window when program executions pass the breakpoint.
- Edit Labels… This option allows setting label for your breakpoint. So it display dialog like this.
- Export… This option allows exporting breakpoint set by developer.

When click on the menu it display dialog that provide information about source code file, line number in code and character. This dialog allows changing line and character information.
For Example:

Change line number to 26 in the in dialog than it breakpoint change to line number 26.


Fox Example:

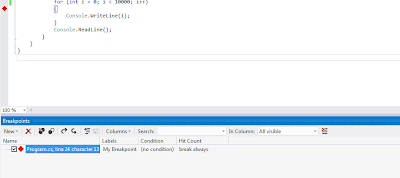
As in above image condition set is “i==1000” that means this breakpoint get hit when this condition is true i.e. satisfied.
This is very helpful when you want to stop execution of the application when certain condition met specially as in example loop having many number of element and want to stop at given location.
Once condition set breakpoint displayed as below.

Breakpoint changed to read icon having + sign in it. When mouse get over on breakpoint visual studio display information related to breakpoint with condition in tooltip.
For Example:

Over here variable “i” is entered in the dialog i.e. if the value of variable “i” get changed than execution of program get stopped at breakpoint.
Below image shows the tooltip on breack point once condition set.

When this option utilize than in breakpoint context menu condition option get check as in below image.


This dialog box has three options which allow to set hit count and if the hit count matches than program execution get stop at breakpoint. Each option is self-explanatory you can see in following image.


This option converts breakpoint to Tracepoint i.e. so the developer can do tracing of the import variable or things by printing message on the output window when code at trace point get executed.
For Example:

As in above image to read value of the variable developer created message that get printed on output window each time code in for loop get executed.
You can read the text in dialog which also provides information about how to provide information in the textbox so that it gets print to output window.
Once developer press ok by setting the tracing message breakpoint get display like square as in below window.

So when this program gets executed in visual studio, messages get printed to output window as shown in below image.


This is helpful when developer exporting breakpoint from visual studio, help to remember how important breakpoint it via label, create of useful breakpoint by using same name etc.

This exported breakpoint information get saved as “XML” as show in above image. Exported XML file for breakpoint look as below

This option is helpful when developer want to export breakpoint and save it as XML than remove it. When there is need to same breakpoint he/she can load same breakpoint by loading XML file using Debug window of Visual studio.
Breakpoint/tracepoint set by developer in code is get displayed by this window. This window also displays breakpoint with other information.
Following is way which shows how one can start breakpoint window.

So one can either use debug menu and start breakpoint window or make use of short cut Ctrl+D,B.
Following is image of breakpoint window.

This window also has toolbar which allows following, which is also supported by breakpoint menu discussed above.
- Set new breakpoint
- Remove breakpoint
- Delete all breakpoint This option allows to delete all breakpoint which is selected in breakpoint grid.
- Enable/Disable breakpoint
- Export breakpoint
- Import breakpoint This option is not part of the breakpoint menu; it is used for importing breakpoint/tracepoint.
- Go to Source Code
- Go to Diassembly
- Columns This tool menu allows to set number of column in the below grid i.e. in breakpoint window grid which is below toolbar.
- Search Search allows searching breakpoint in the breakpoint grid of breakpoint window. Following is image of the same. As per the criteria specified breakpoint grid window display searched breakpoints.

When this button clicked by developer, visual studio open file browser window to browse xml file for breakpoint / tracepoint.

So after loading this file breakpoint/tracepoint get set again in the code.


Breakpoint Grid
This grid window displays all the breakpoint set by developer in source code. This grid provides information about each breakpoint according to columns set by developer in grid.

Conclusion
Breakpoints/tracepoints are very useful feature provided in visual studio, which is very usefl when you are debugging large amount of code. Visual studio provides flexibility to break execution of the code during debugging at breakpoint which is very helpful to the developer.


